Difference between revisions of "Analytics/How to Select Analytic Graphics"
From Commence CRM-Help
Technowrites (talk | contribs) |
Technowrites (talk | contribs) |
||
| Line 11: | Line 11: | ||
| − | :::::: | + | ::::::'''''Step-by-Step''''' |
::::::::1. Click on the “Add Components” button on the “Analyt-ics” screen. | ::::::::1. Click on the “Add Components” button on the “Analyt-ics” screen. | ||
| Line 23: | Line 23: | ||
::::::::5. Click on the “Save” button to return to the Analytics screen where your new selection of graphs will be dis-played. | ::::::::5. Click on the “Save” button to return to the Analytics screen where your new selection of graphs will be dis-played. | ||
| − | [[File:image198.jpg]] | + | ::::::::[[File:image198.jpg]] |
Revision as of 08:07, 17 September 2012
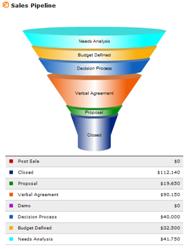
You may select which graphs appear by using the “Add Com-ponent” function.
- Step-by-Step
- 1. Click on the “Add Components” button on the “Analyt-ics” screen.
- 2. When the “Add Components” screen appears, highlight an “Available Component” and click on the “Add” but-ton to move it to the “Show these Components” portion of the screen. Repeat this step for as many graphs as required.
- 3. To remove a graph from display, highlight the compo-nent in the “Show these Components” area and click on the “Remove” button to return it to the “Available Components” section.
- 4. If desired, you may change the order in which graphics appear by highlighting a component name in the “Show” area and using the “Up” or “Down” buttons to change the order of display.
- 5. Click on the “Save” button to return to the Analytics screen where your new selection of graphs will be dis-played.


